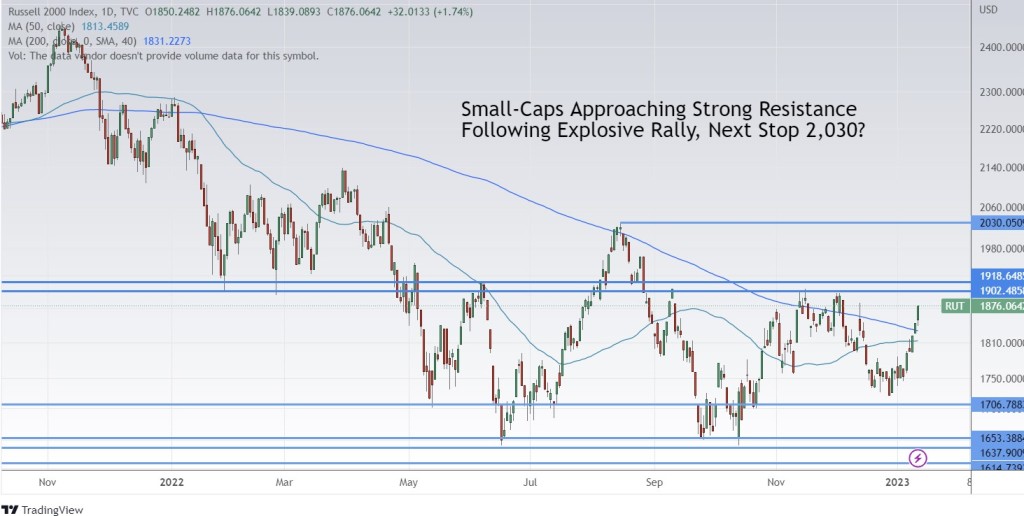
With the U.S. earnings season upon us, it’s worth taking a look “under the hood” to see how lesser-known stocks have been doing lately. A quick way to do that is to look at the Russell 2000 which, while far from being a perfect indicator, can still give you valuable at-a-glance info regarding the health of the market. So what are small-caps telling us right now?

In one word: interesting… but let’s look at the chart in detail!
So, if we accept the Russell 2000’s value for a second, then we can conclude that 2023 has been very kind or equity bulls, so far. The Russell is up by over 6.5% year-to-date, it broke both its 50- and 200-day moving averages this week, and it looks ready to test the 1,900-1,920 resistance zone that stopped its advance a whopping four times in 2022. Above the way to 2,000 and the 2.030 resistance level would open up for the small-cap index, and bulls could solidify their position above the key moving averages. A move above 1,920 would also make another leg lower in the Russell’s bear market less likely, but it’s too early to say that the index’s summer lows are safe.
Fundamentally speaking, small-caps should be in a tough spot as funding costs are at their highest in years, growth is sluggish, and last year’s risk selloff favored, in general, more stable businesses. All of those could explain why the Russell is down by over 20% from its all-time high, but, since yields likely peaked for the current cycle, we could be seeing a major shift. In case of a positive growth scenario, small-caps would look attractive and that’s likely behind their current strength.
Will this week’s surge be the start of something bigger for small-caps and, in turn, the U.S. market? Fourth-quarter earnings and the market’s reaction to them could give us a strong hint and while short-term technicals are favorable, there is still a mountain of resistance ahead for the Russell, so going all in might be a bit risky.
Stay safe out there!