Don’t get me wrong, today’s CPI reading was a crucial data point, but it’s just that, one data point. For short-term trading, it makes sense to focus on it but long-term, robust trends are what will drive returns in all asset classes.
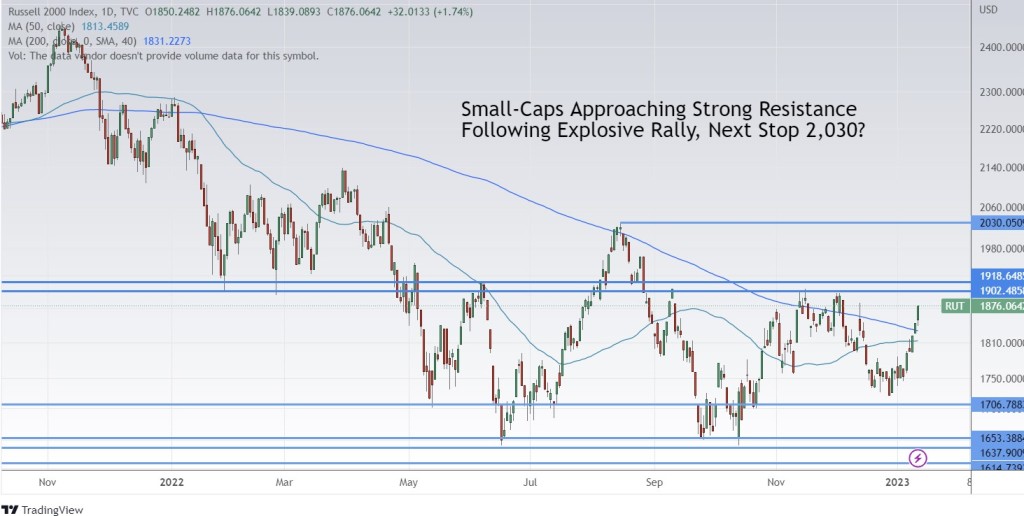
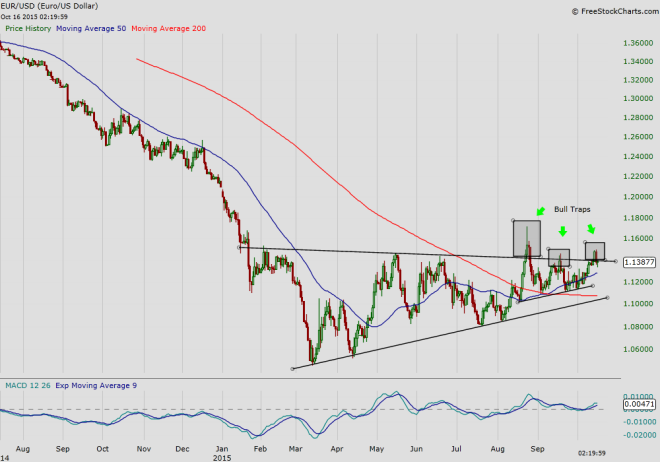
From an investment standpoint, there are much “juicier” charts to look at, nine-month highs in Europe, improving breadth in the U.S., copper’s breakout, fresh rally high in the EUR/USD, the rally in travel stocks… you can choose your poison, there is plenty of action across markets.
What connects all of these is the improving outlook for global growth due to China’s reopening. That’s probably the most important new narrative of 2023, and while uncertainties abound, for now, the market seems to run with the idea.
The war-fueled rally in agro-commodities and energy is a thing of the past (and maybe the future…), with wheat, corn, and crude oil all trading at or below pre-war levels, but “Dr. Copper” just broke out to a seven-month high and never looked back.
Let’s see the chart!
Continue reading →

